
The office side: today's numbers, today
Every field report lands as productivity against a target. Prōduk! turns it into burndowns, early warnings, reports and a morning digest, without anyone re-keying a thing.
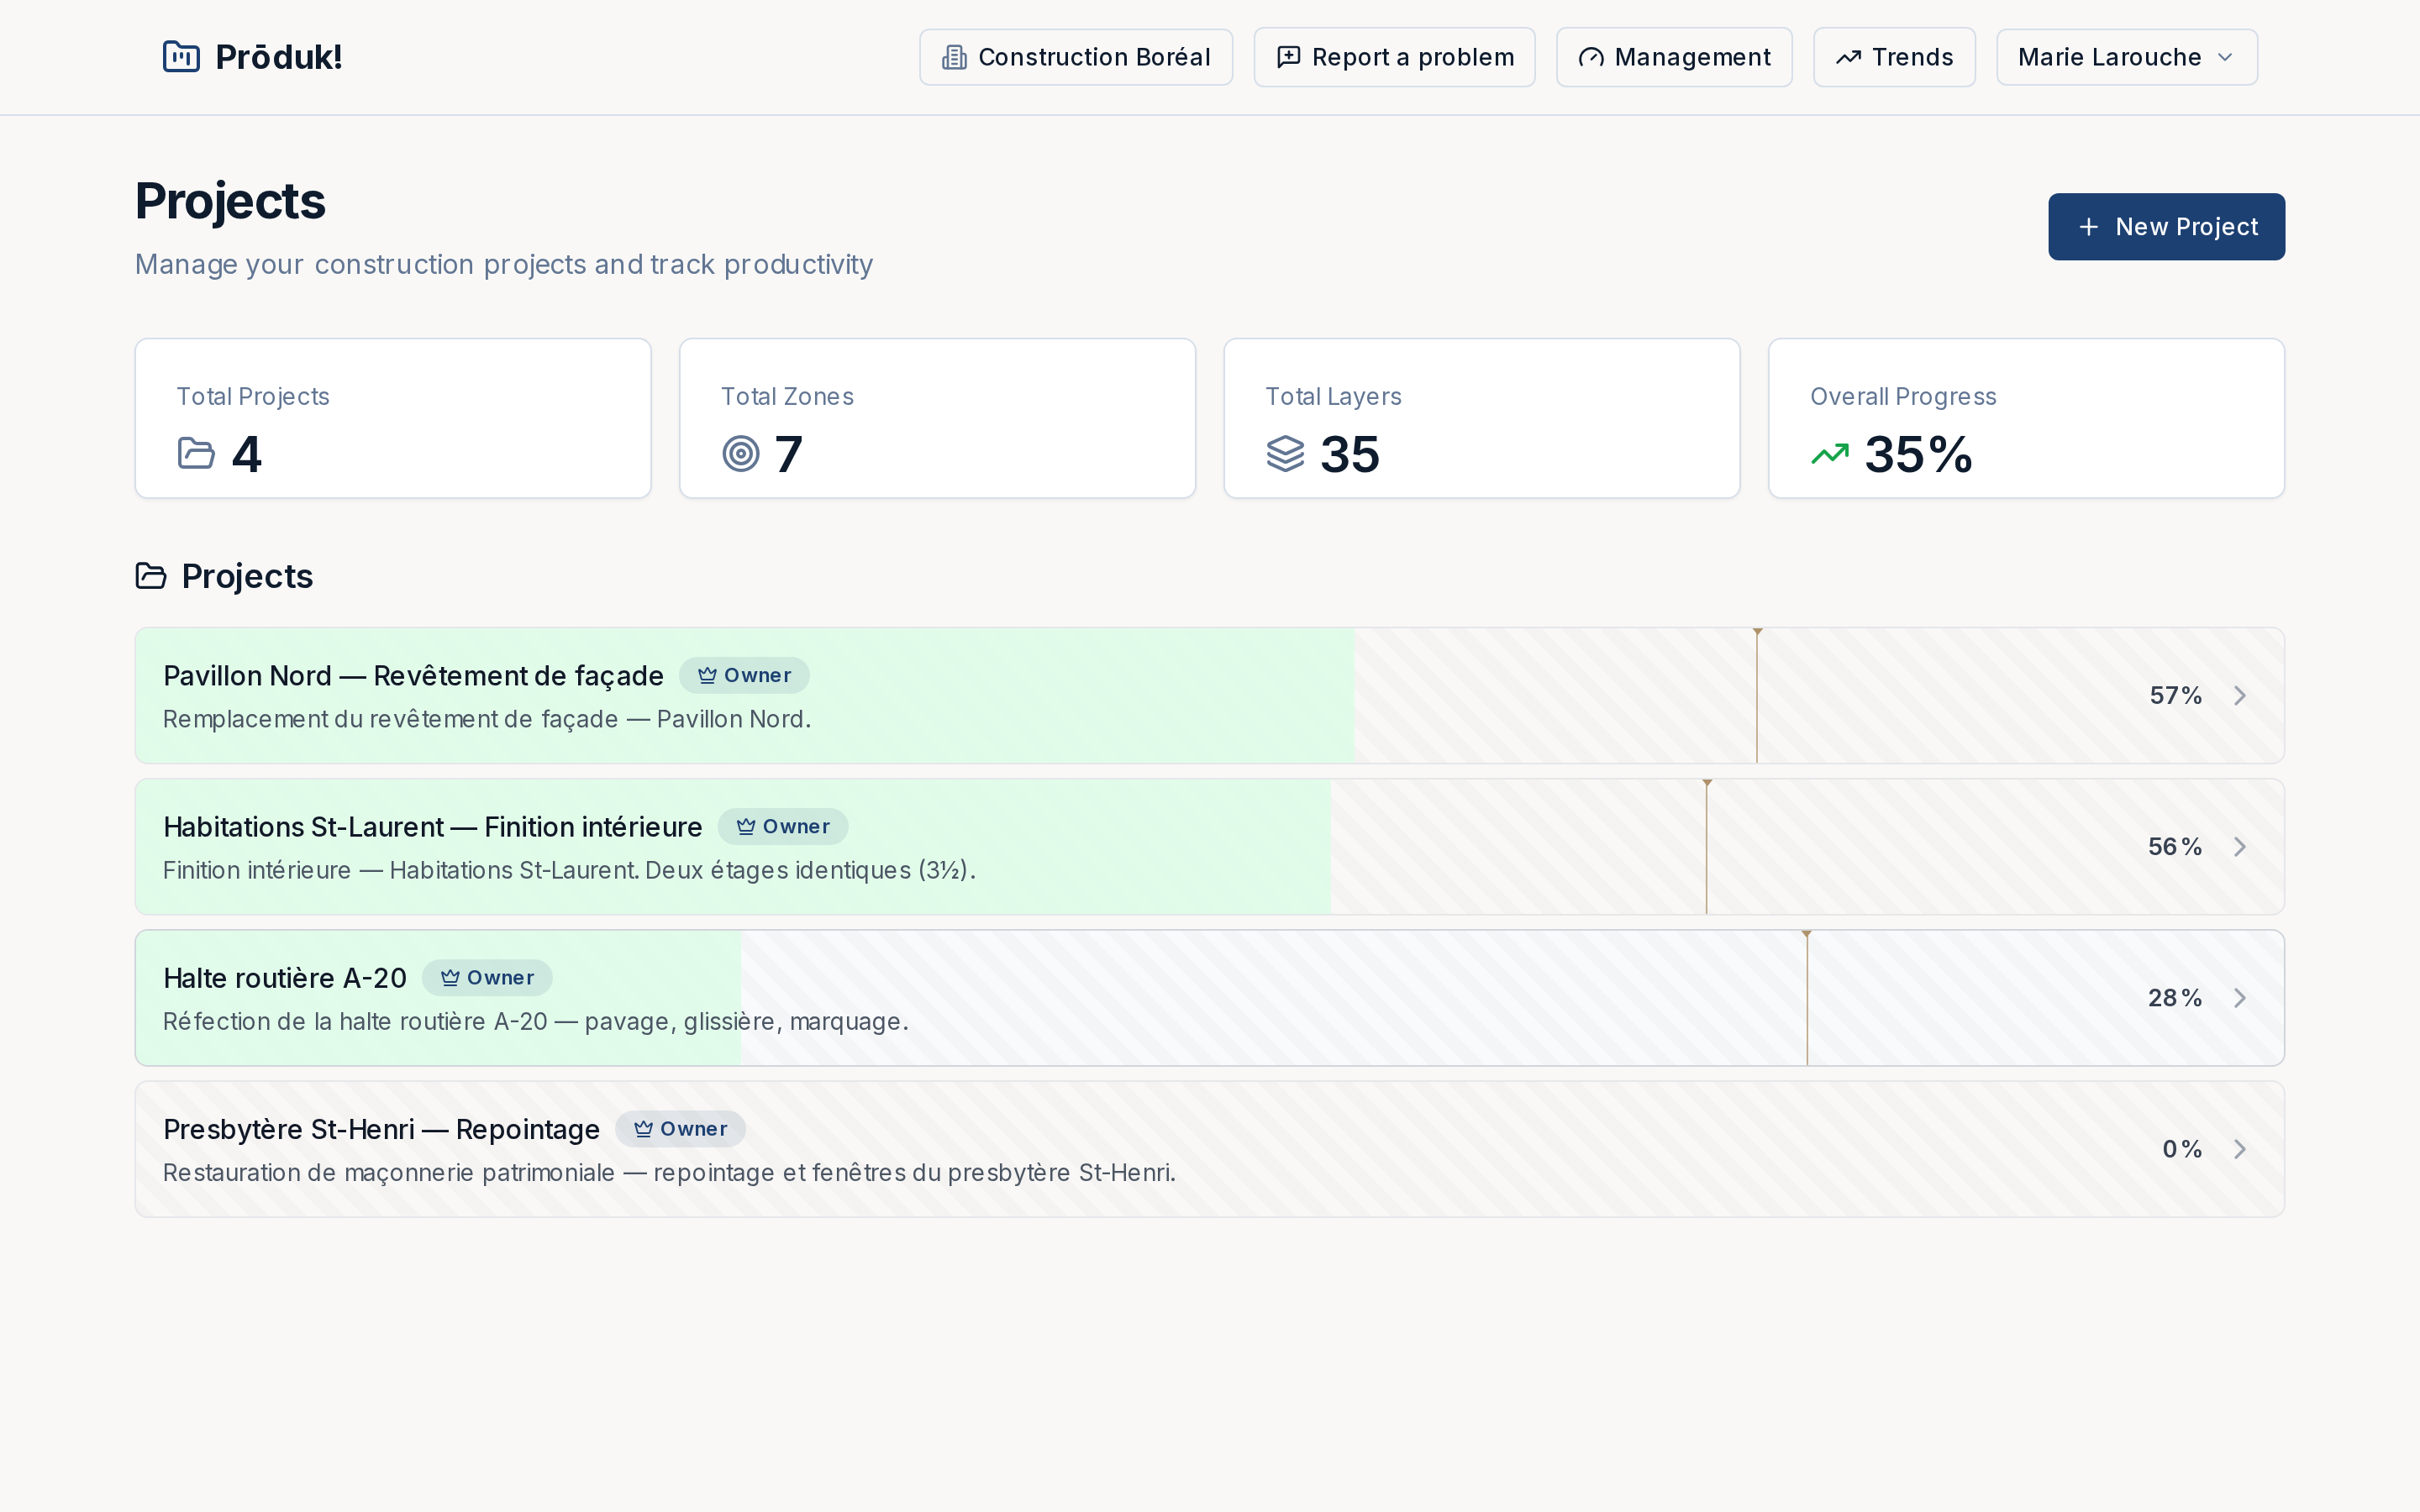
Set up a project in an afternoon
- Upload the shop drawingsPDF or image. Prōduk! reads the scale off the drawing, or you set it once from a known dimension.
- Draw the zonesOutline each elevation, floor or section directly on the plan.
- Add the layersThe activities a crew actually does, in order: membrane, insulation, brick, panels, sealant. Each gets a production target and a date window.
- Invite the teamForemen see what they report on. Project managers see the numbers.
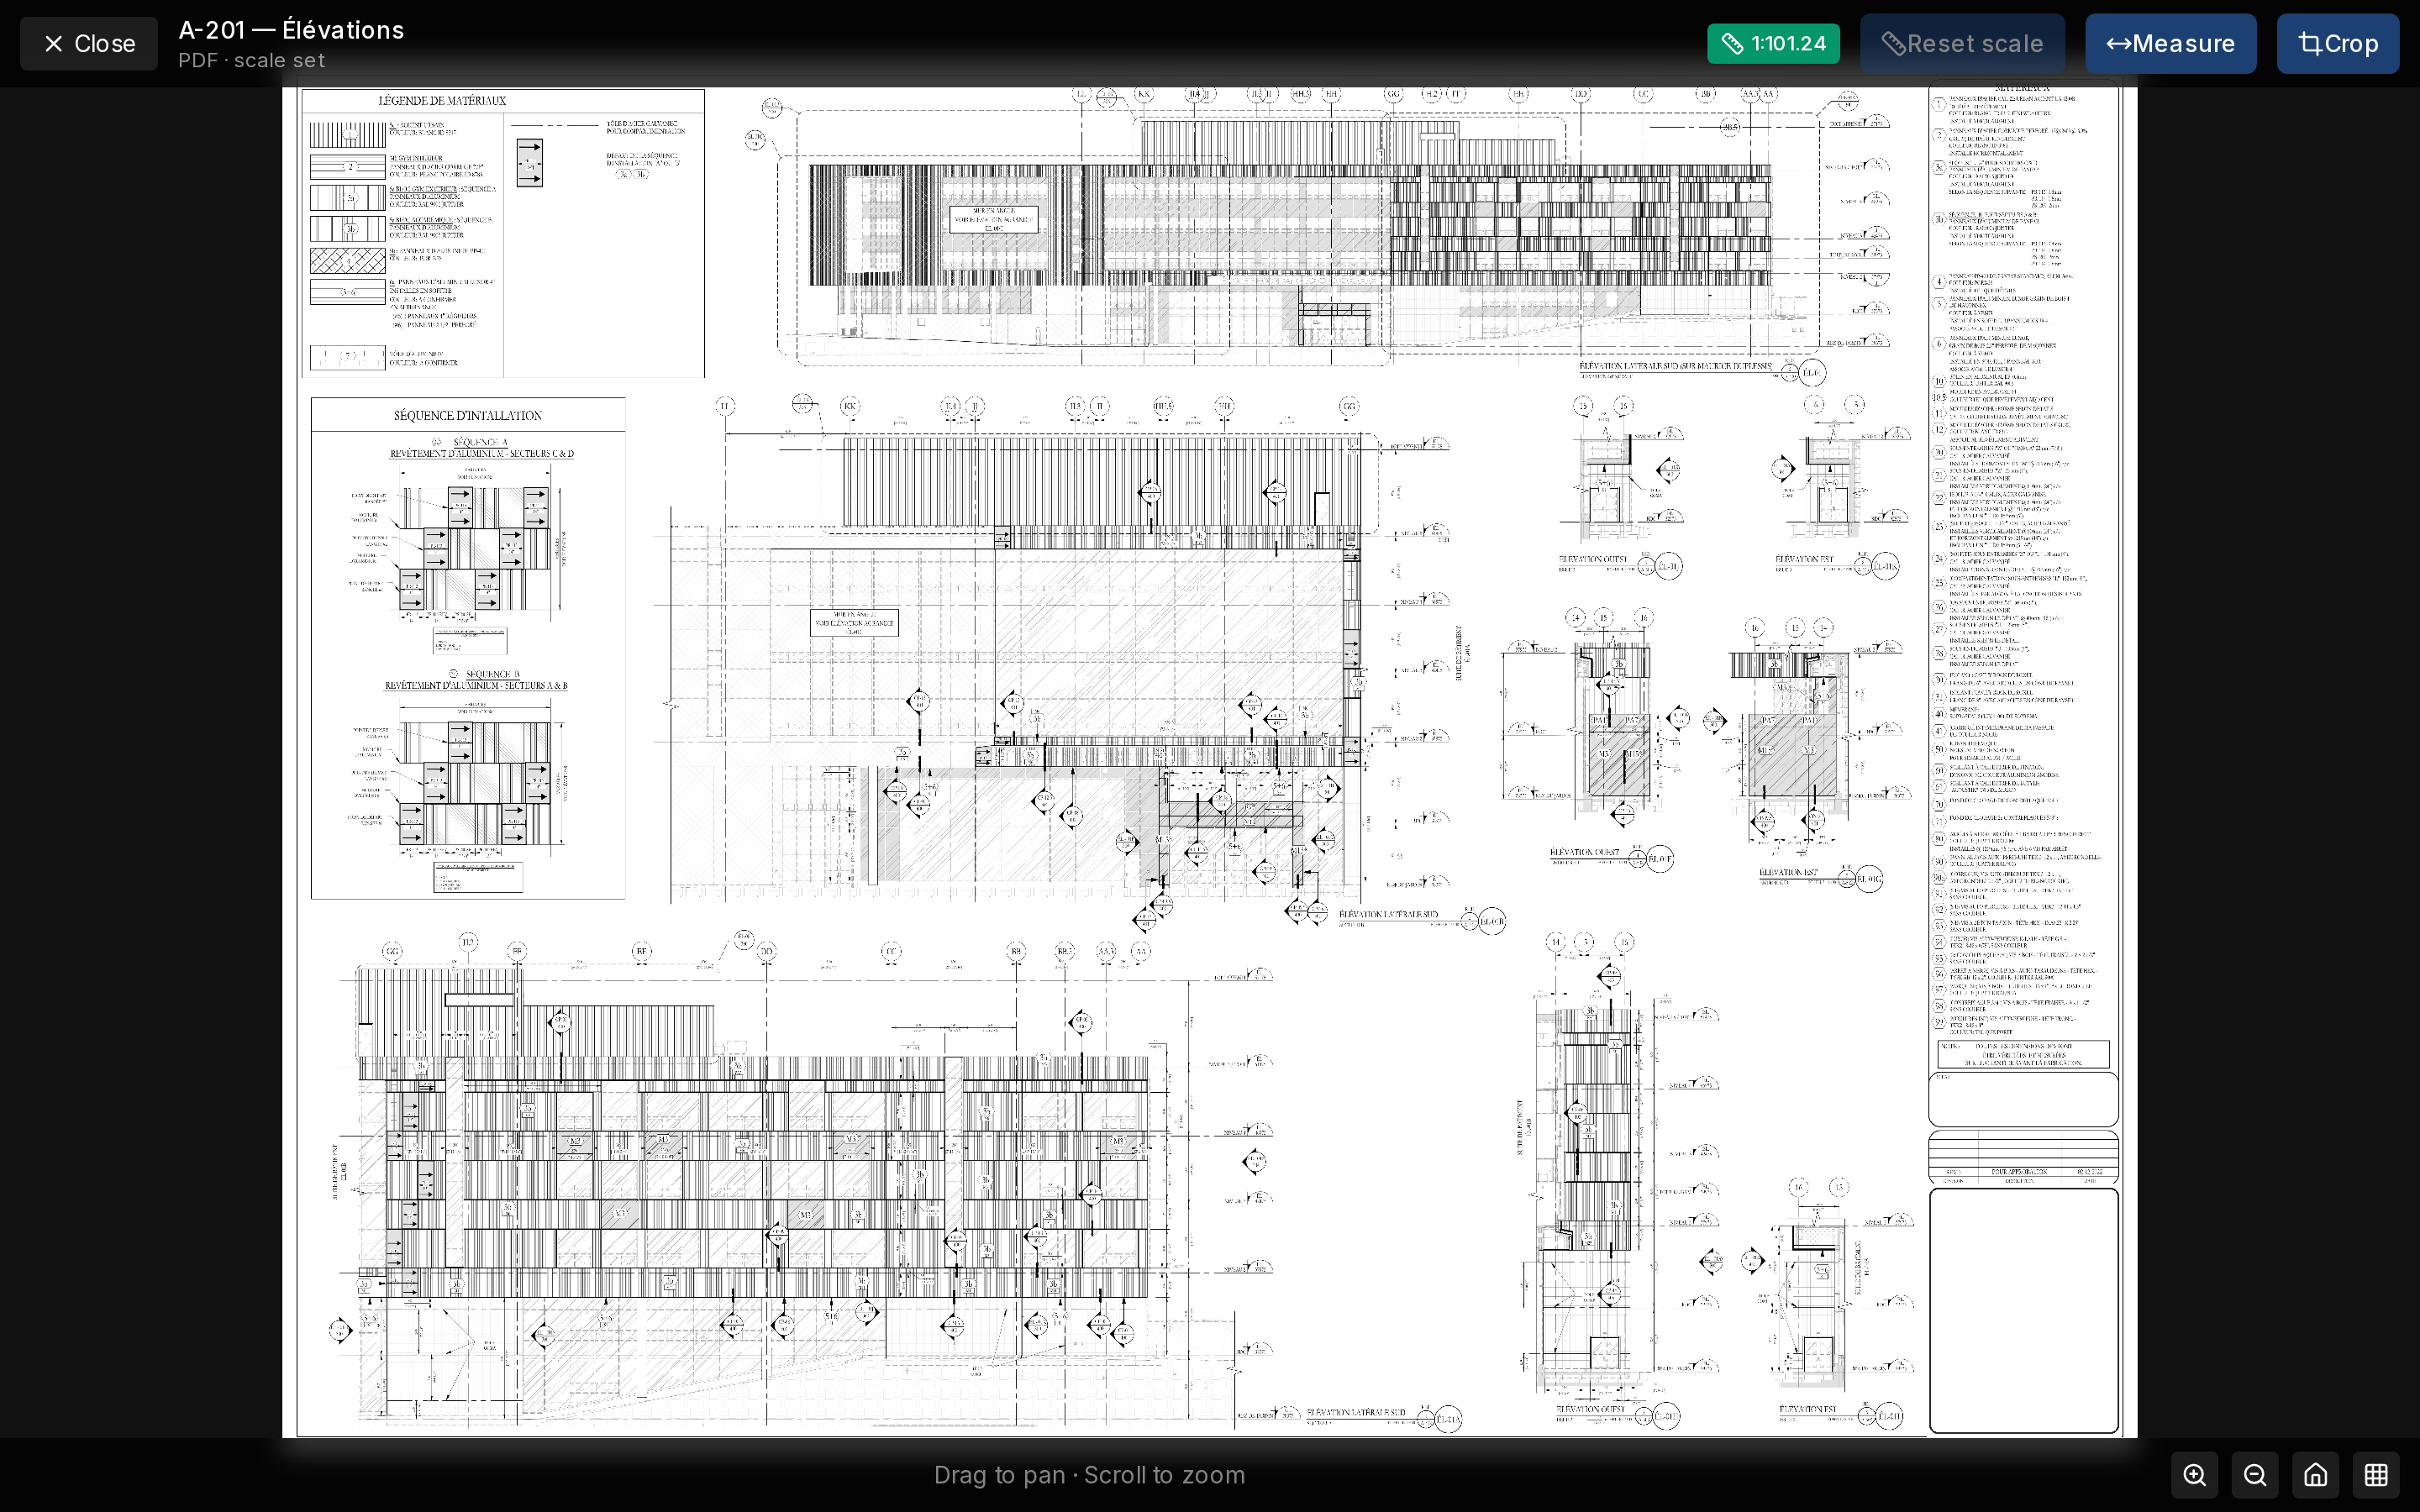
Every layer's rate against its target
Each zone opens to its layers: quantity, target rate and progress. A layer falling behind its target is flagged right on the row.
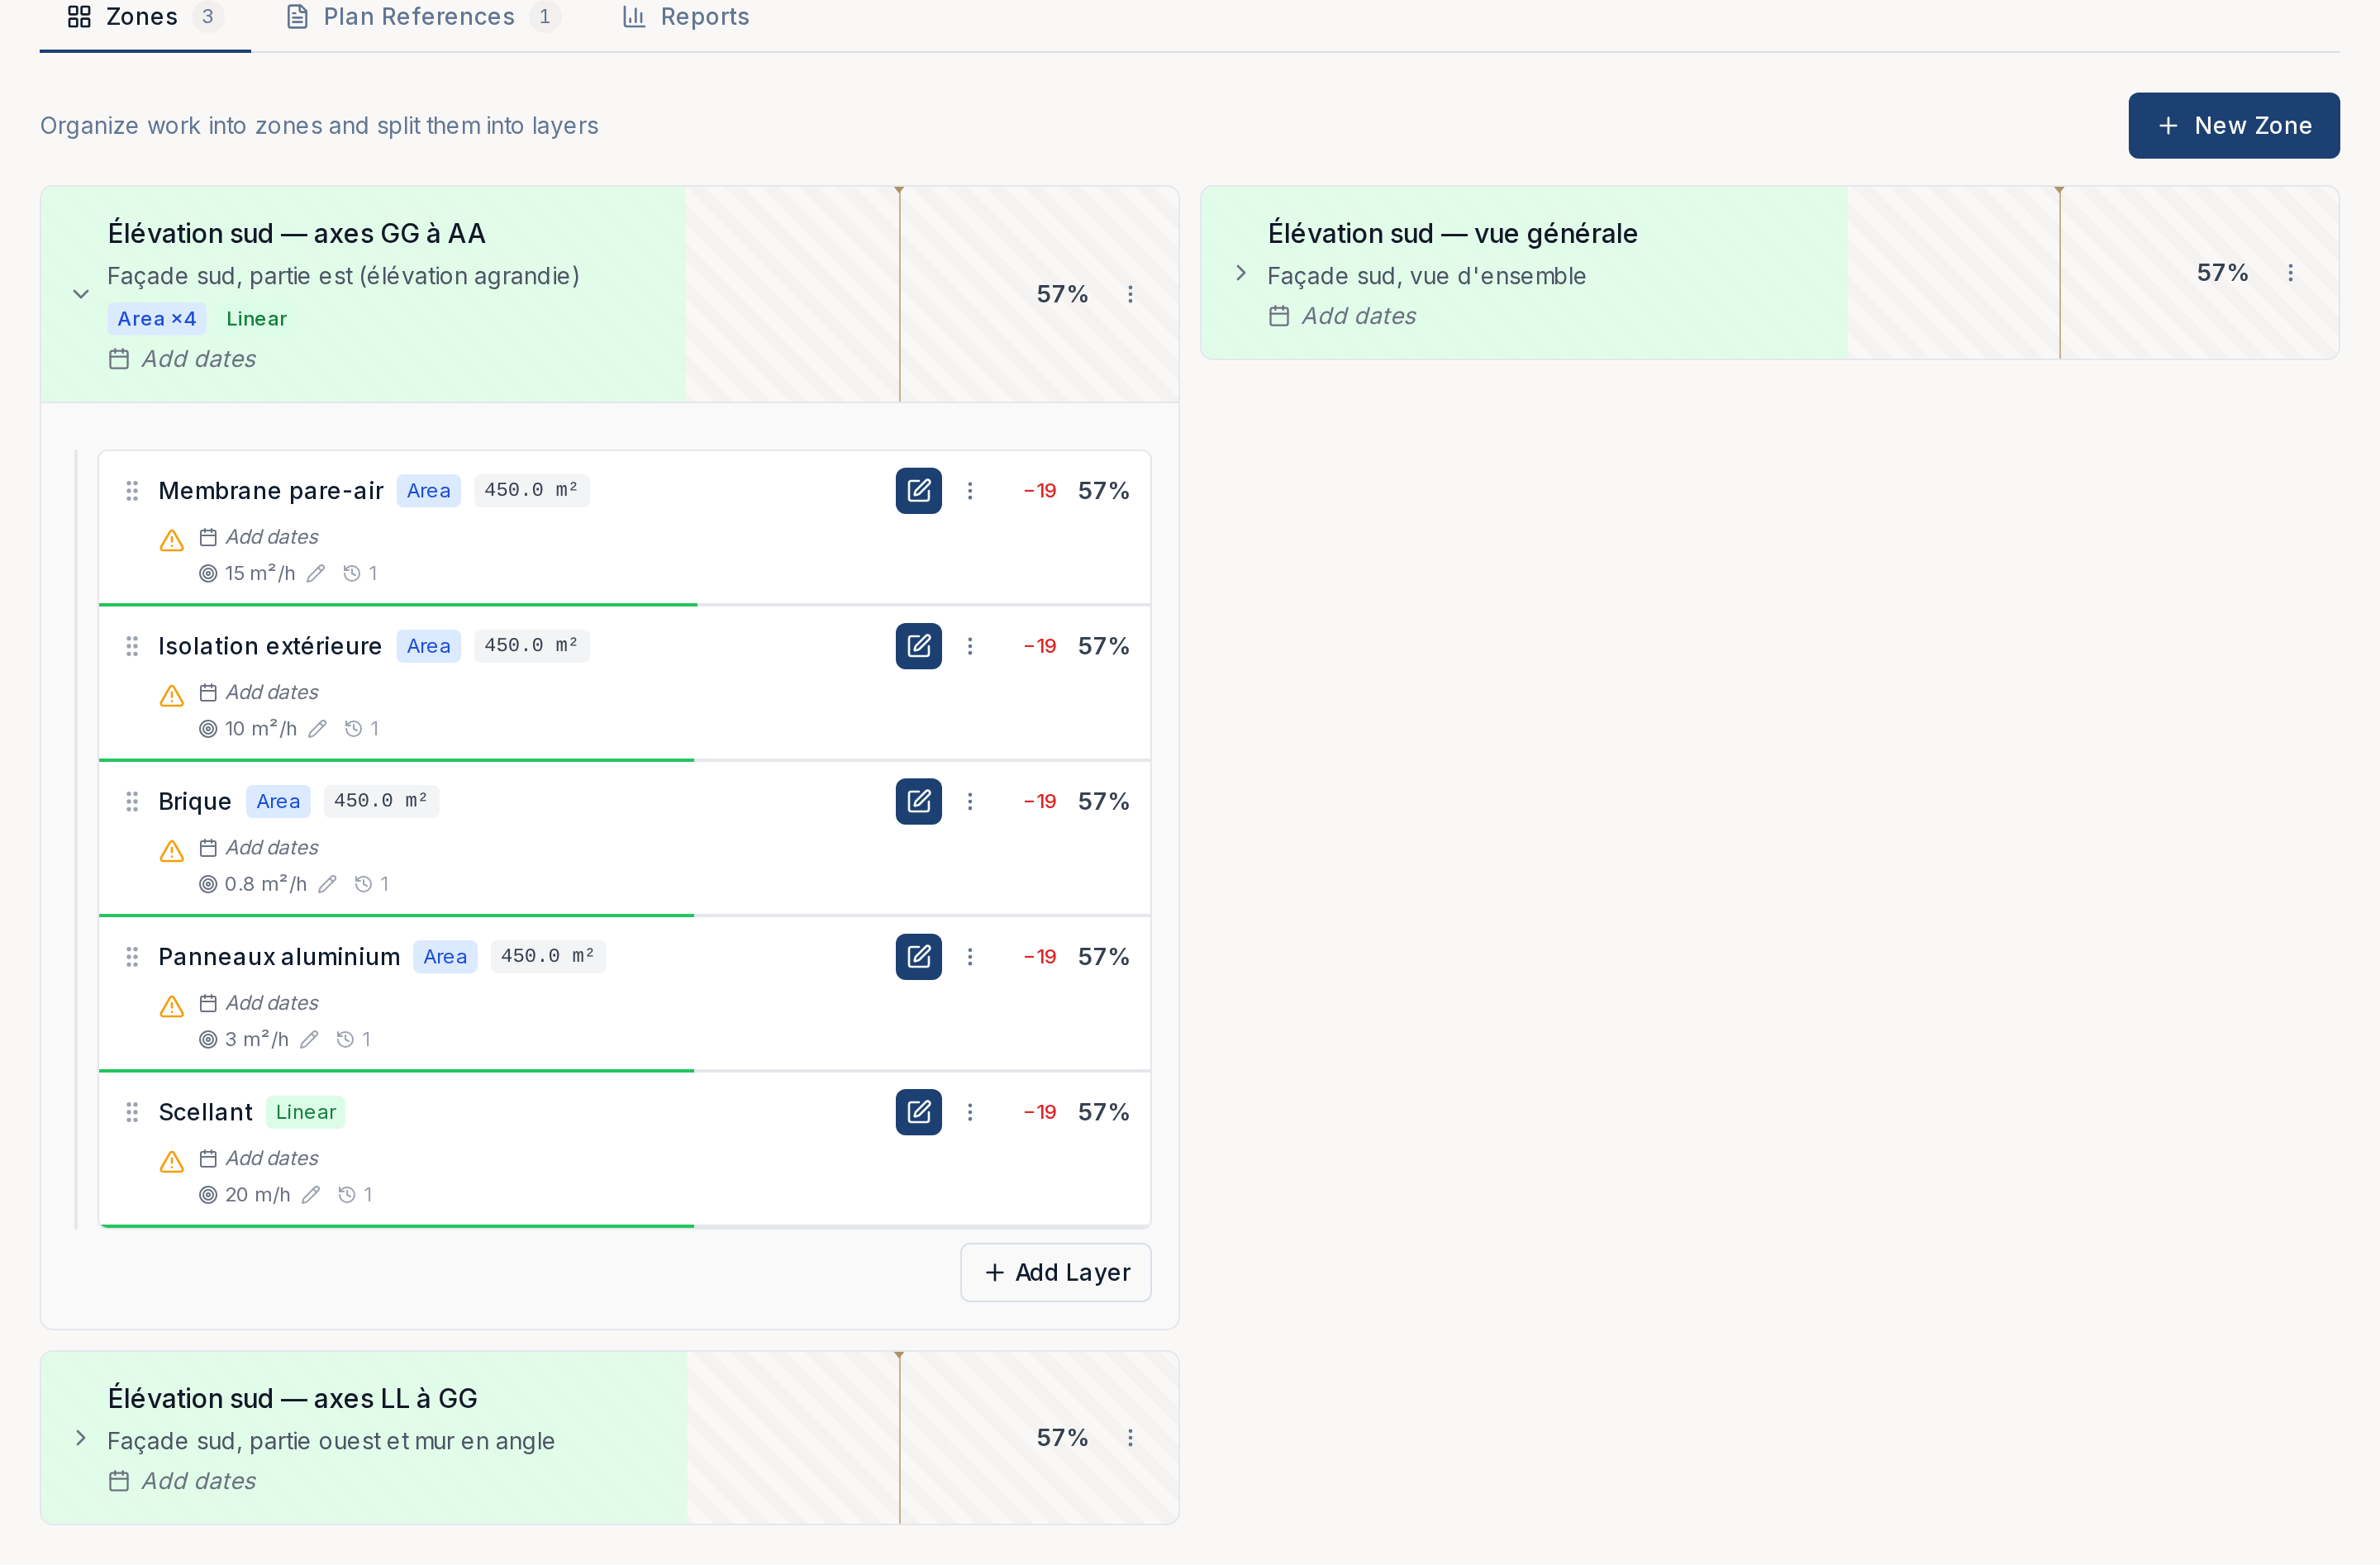
The whole story on one page
Remaining work against the plan with a forecast finish, productivity day by day, and every correction with its reason. Print it for the client meeting.
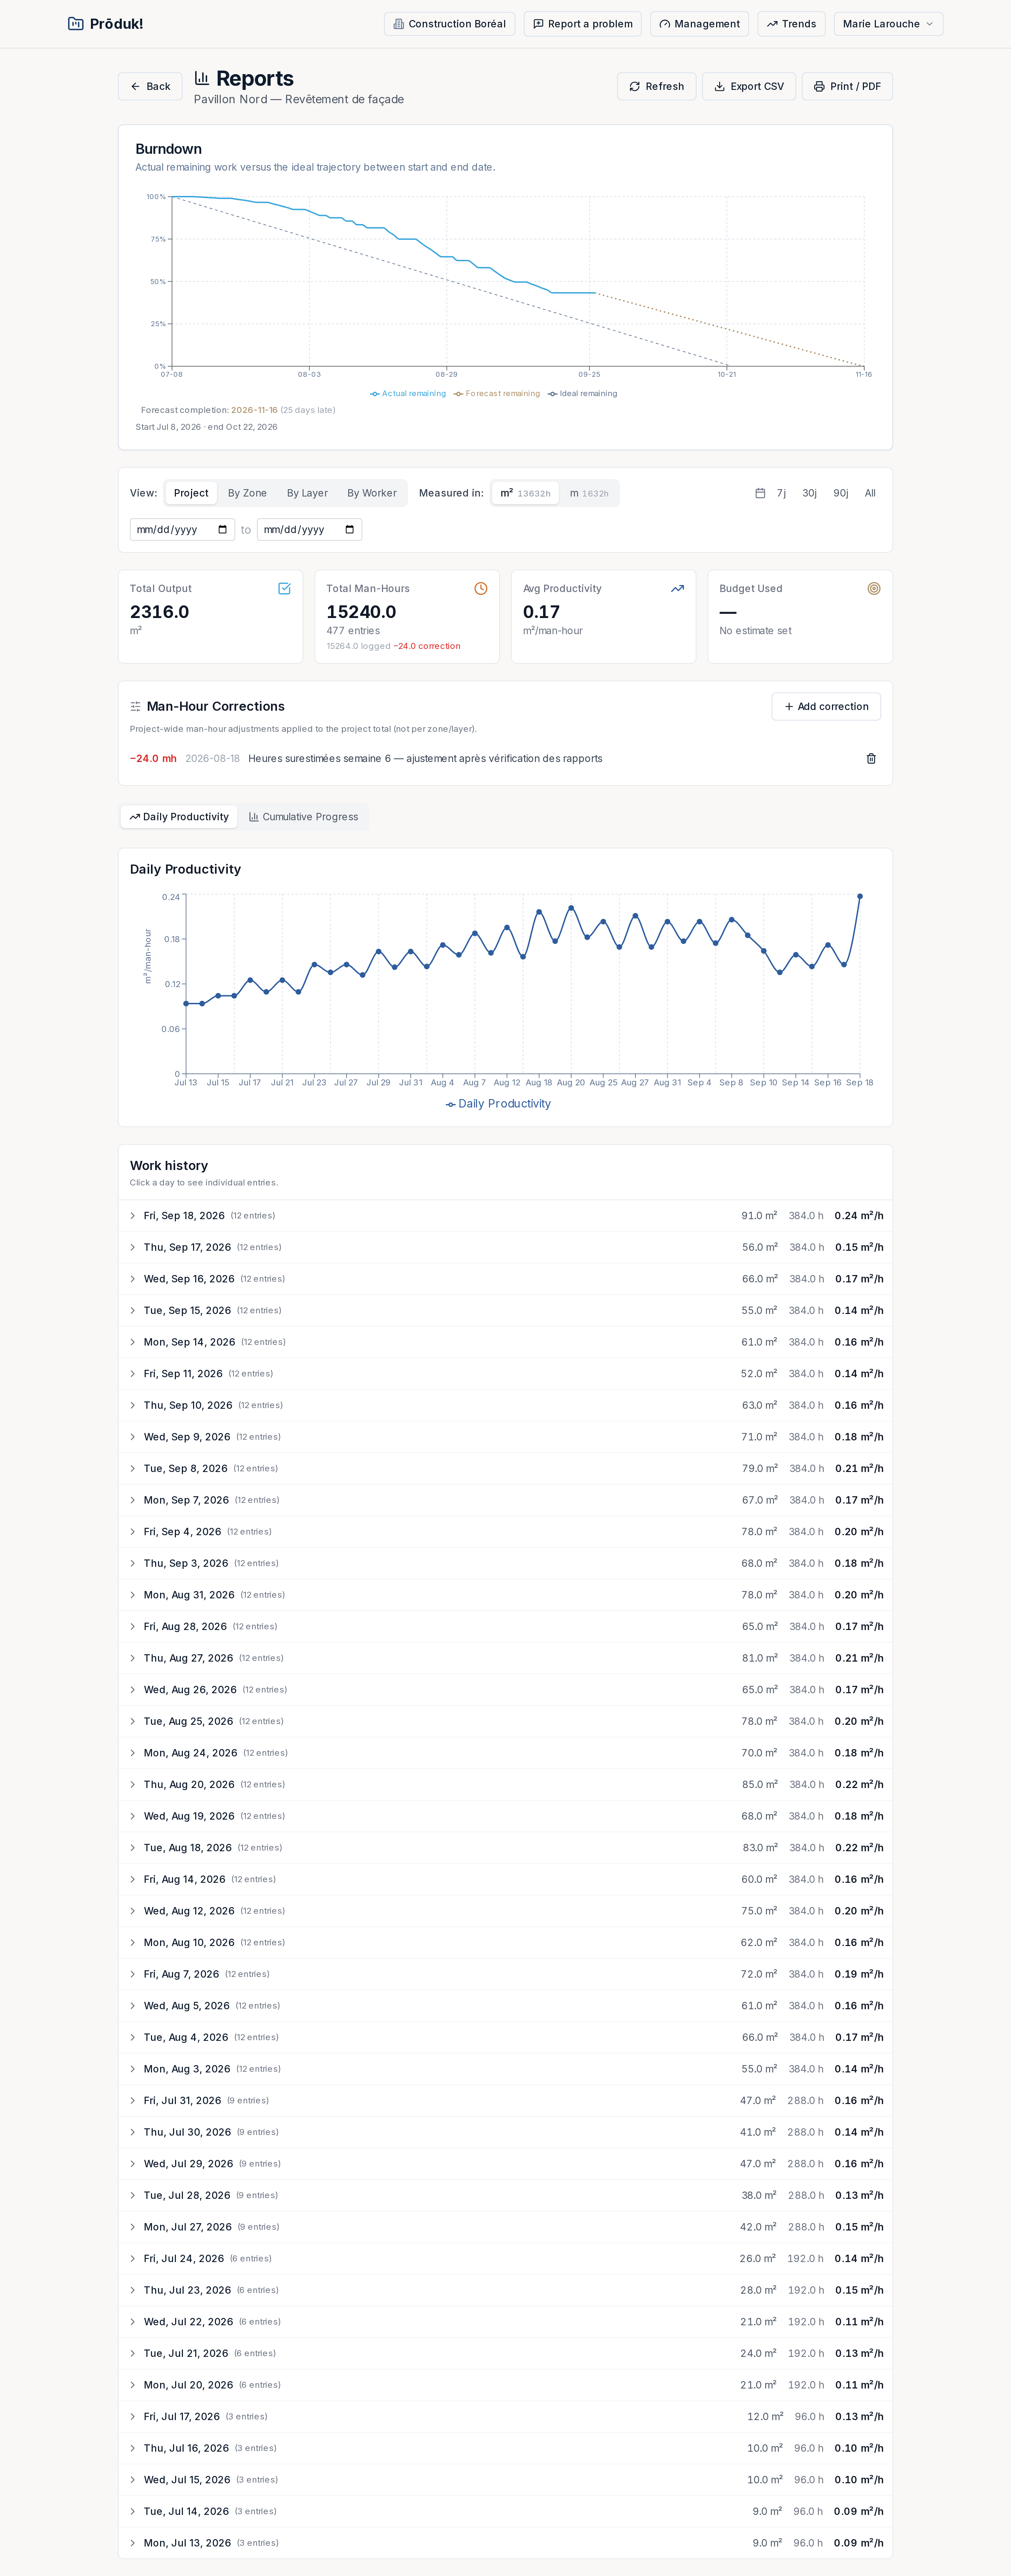
Across the company
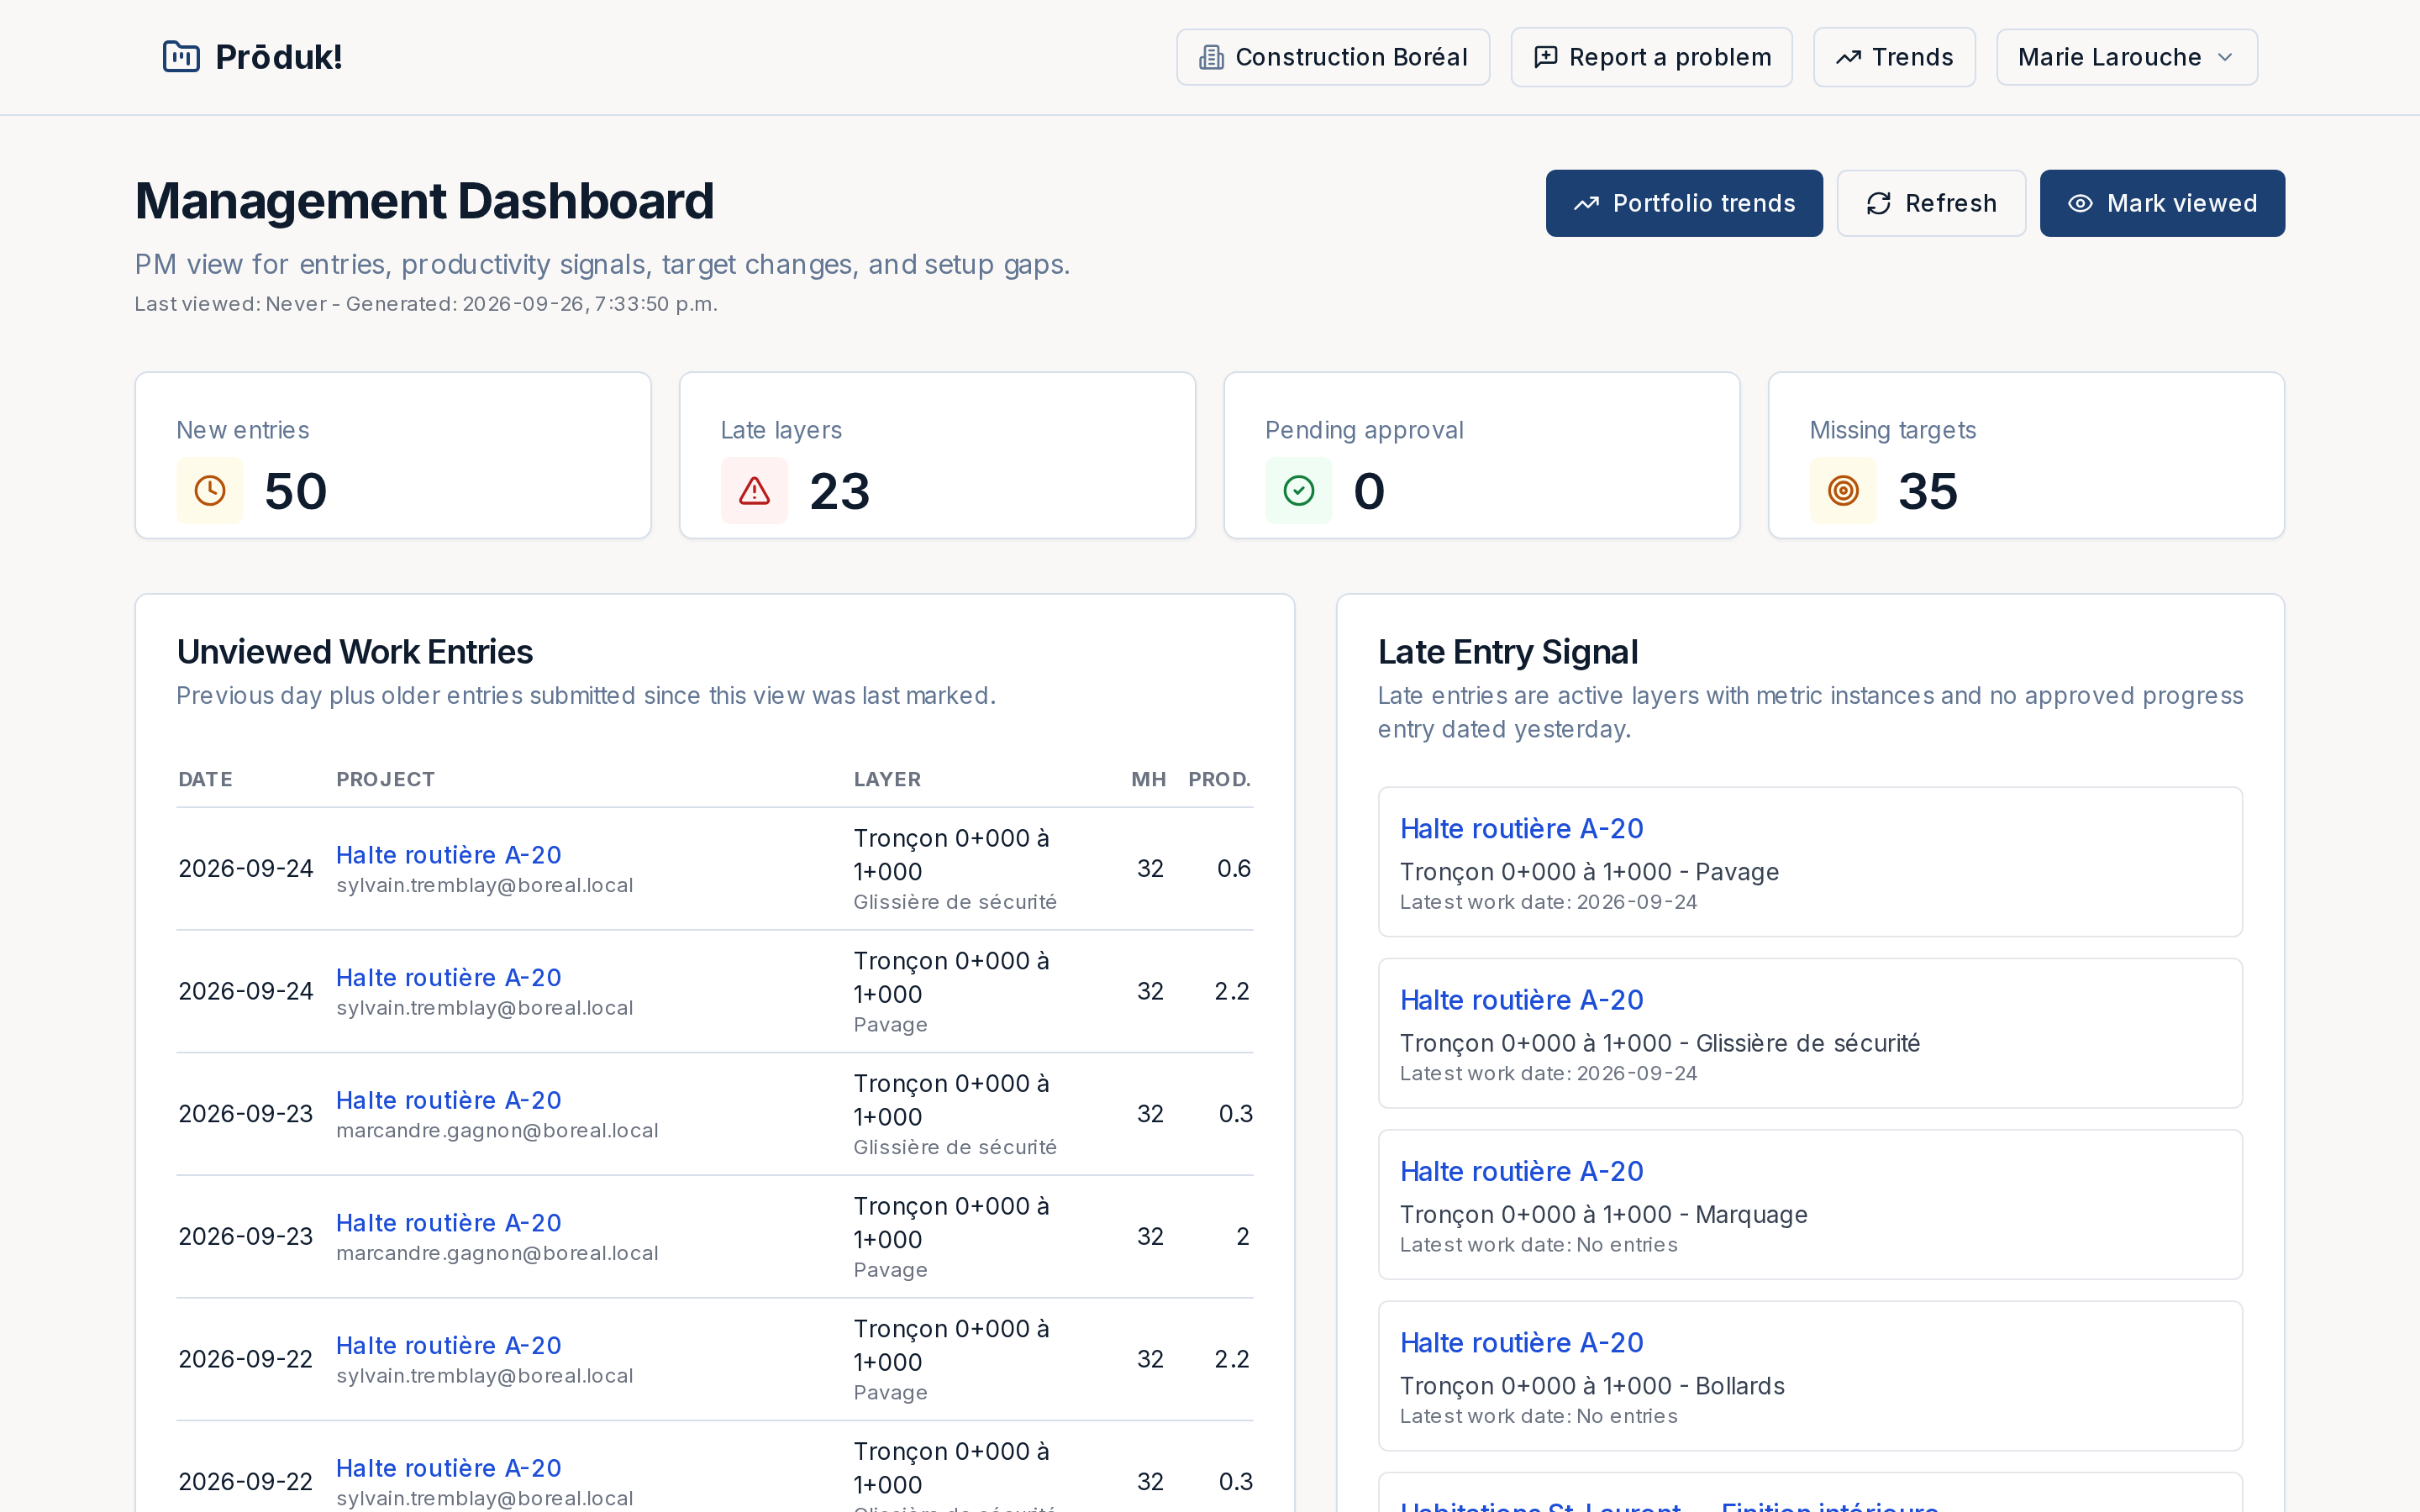
Management sees every site on one page: what came in since they last looked, which active work went unreported, and which projects are improving or slipping against target.
Each morning, a digest email brings yesterday's productivity per project and the work that needs attention. It reads fine on a phone in the truck.
Boring in the ways that matter
Nothing gets lost
Deleted work goes to a trash you can restore from. A wrong quantity gets a correction; the original stays on record.
Your data stays yours
Continuous backups, and drawings and photos private to your company.
Sits beside your other tools
Prōduk! doesn't replace your ERP, scheduling or document system. It's the production numbers they don't have.
See your own numbers by the end of the week.
Send us a set of drawings and we'll set the project up with you.